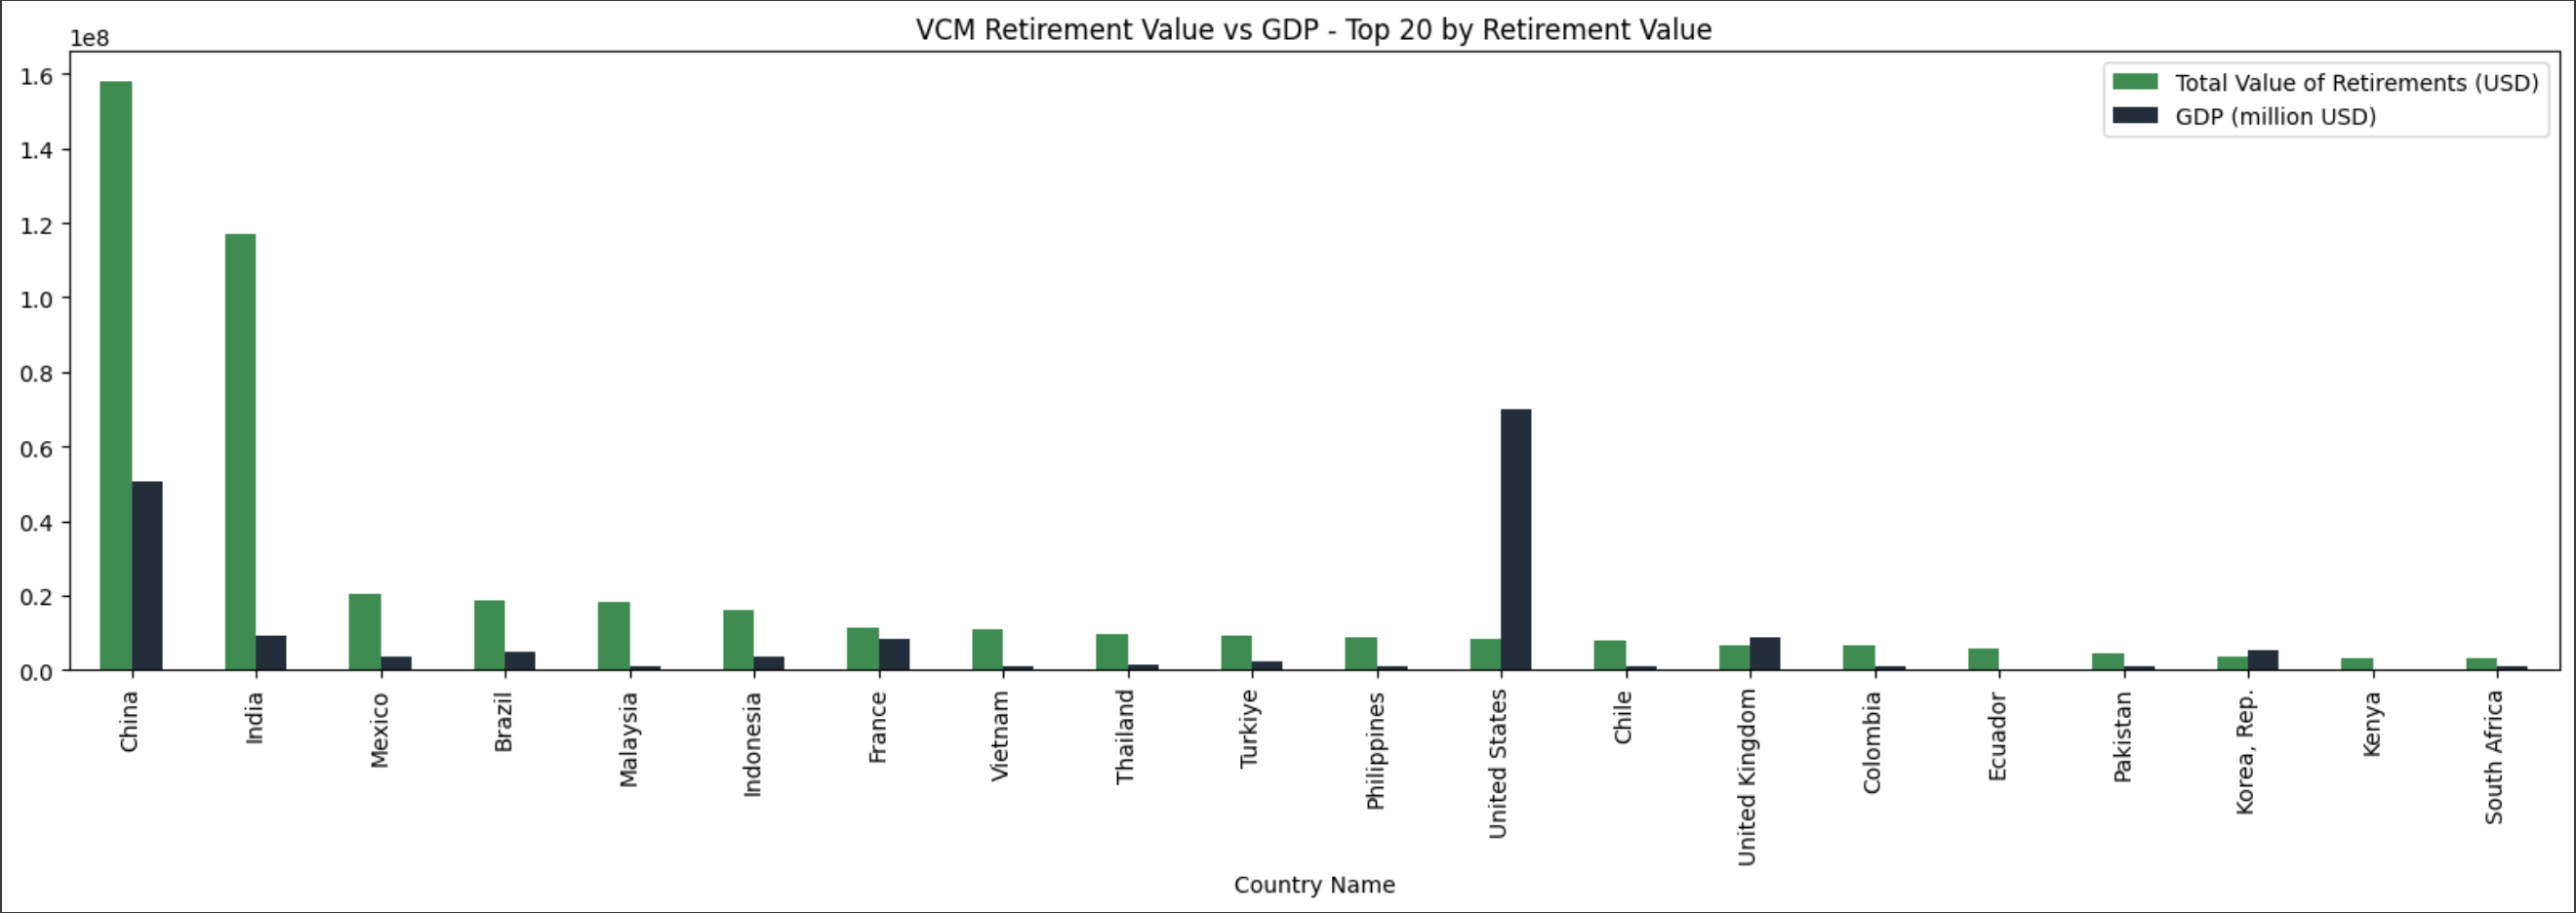
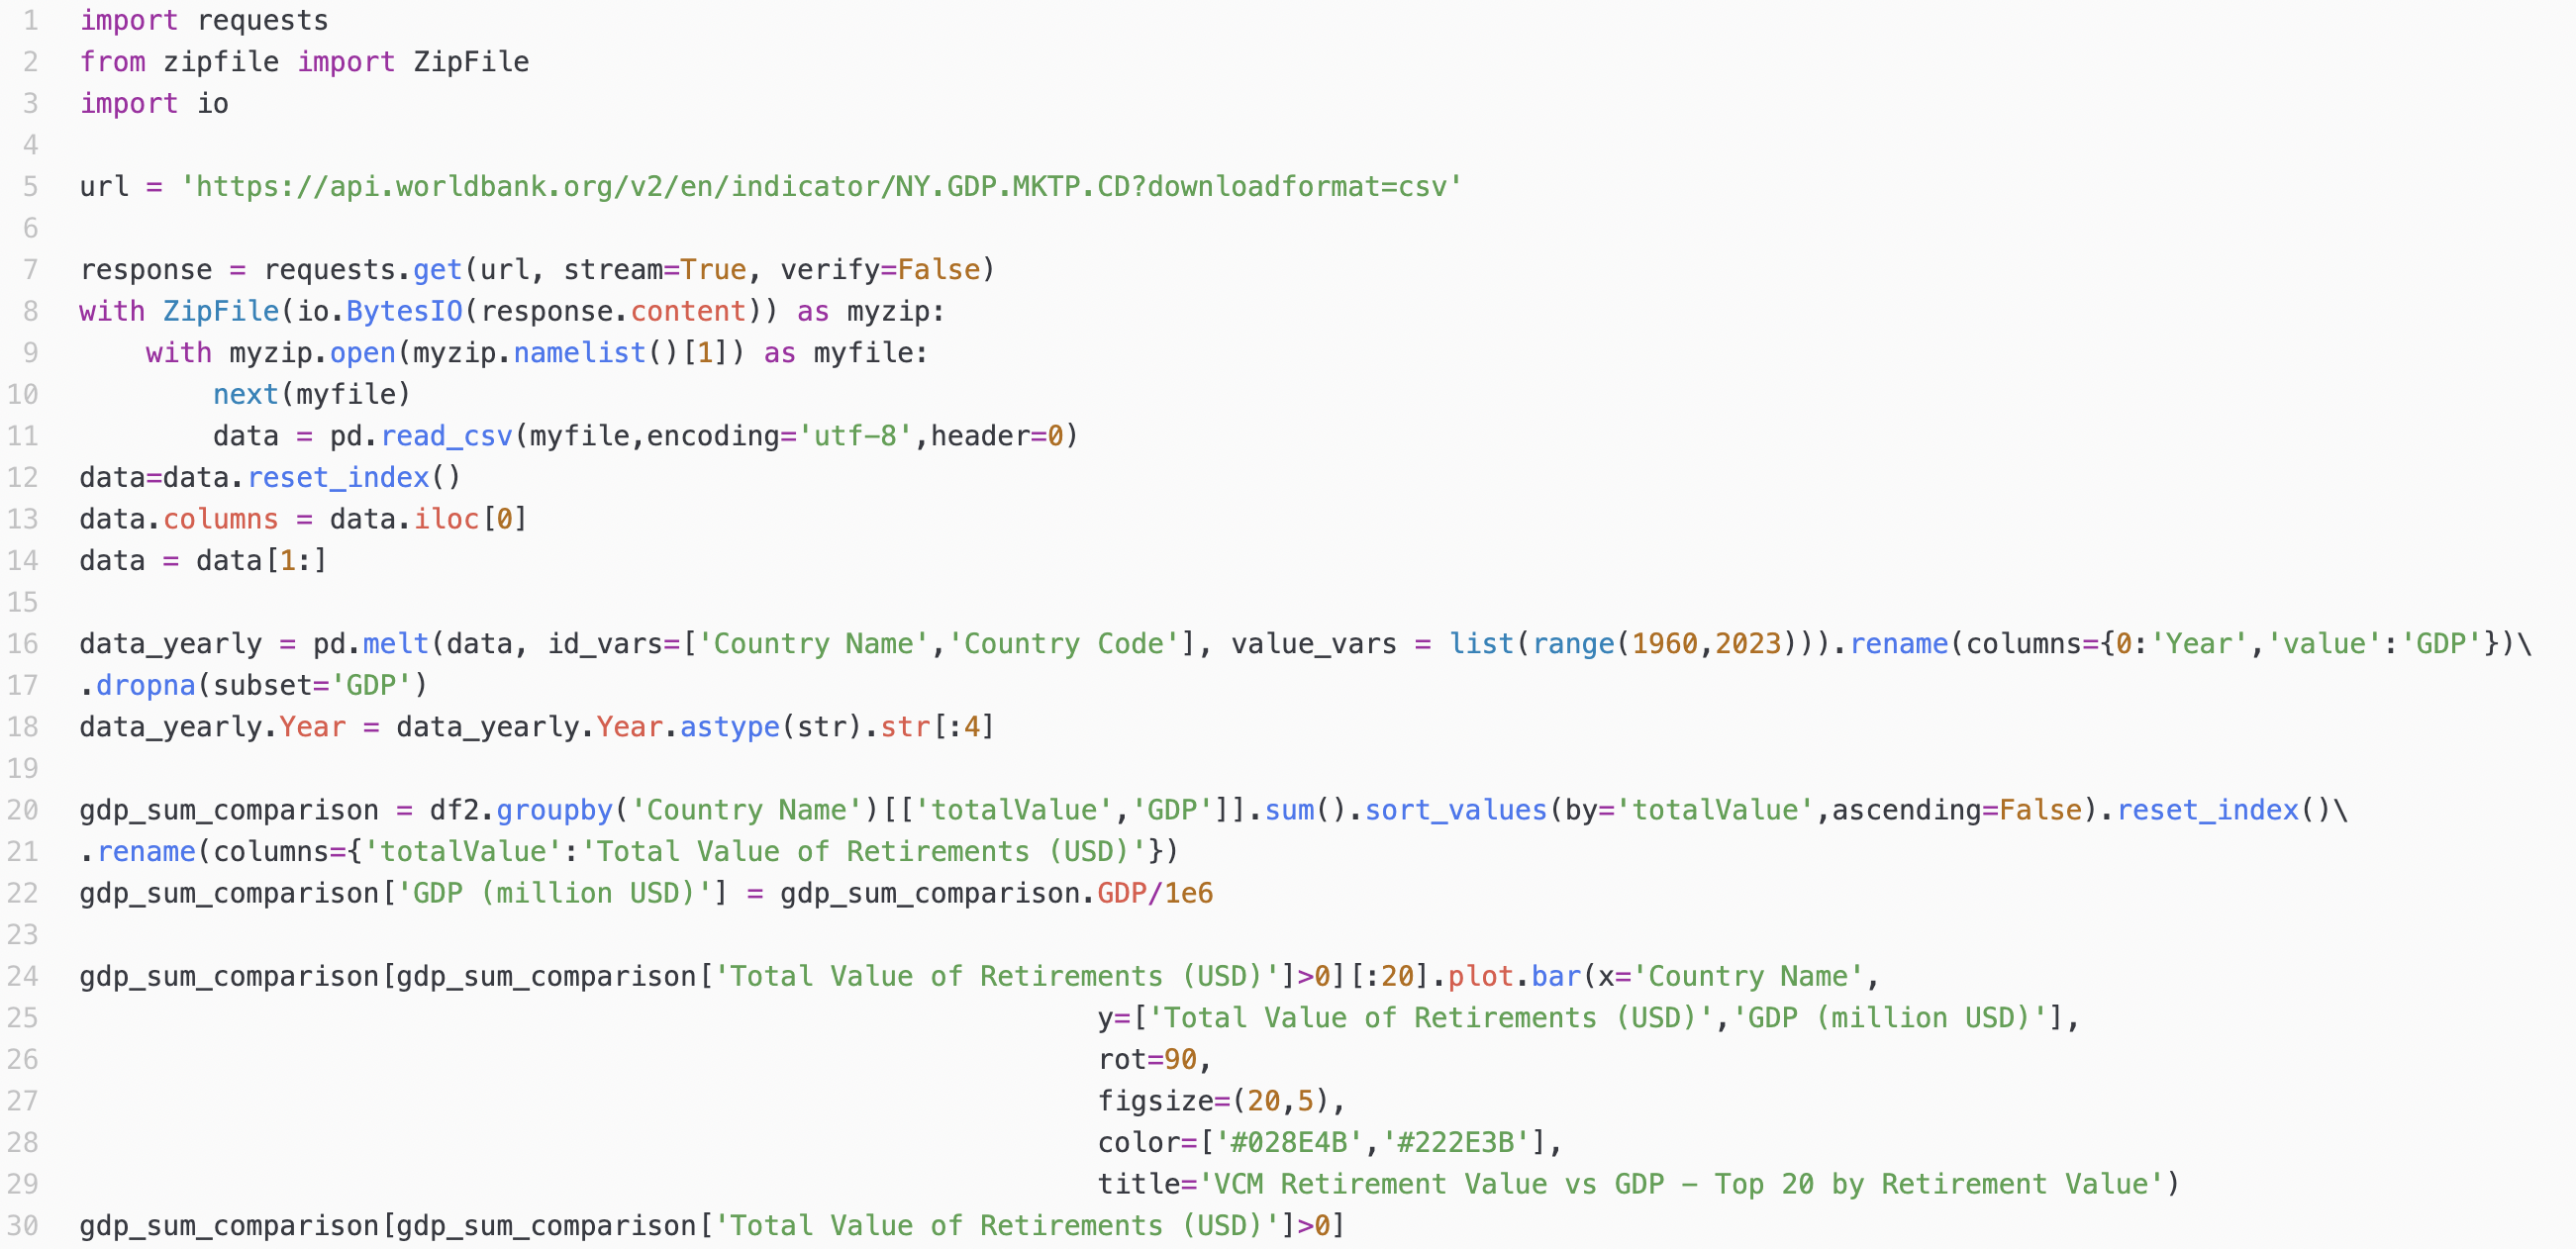
The below script allows one to quickly understand how much value carbon projects generate in each country, compared to the national GDP per capita. Simple visualizations help to make the ratio more intuitive and immediate. The script builds on two of the main AlliedOffsets’s database tables: project-level information and our industry-leading and proprietary pricing estimates for each credit transaction. The script is written to easily allow you to select a sub-set of countries that you might be interested in, and offers you additional sources that you can consult for GDP information.
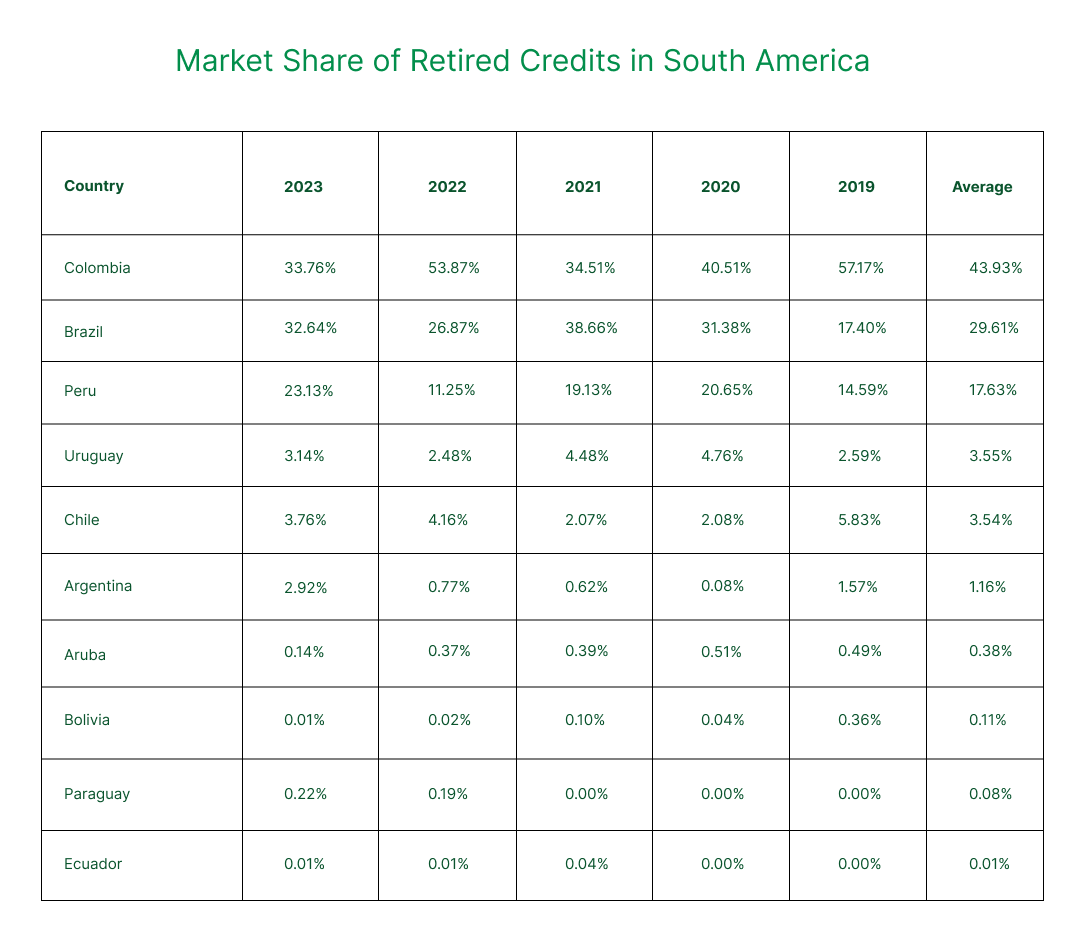
These metrics depict the proportion of retired carbon credits in each country, providing a lens into their contribution to the VCM.
Colombia has had a 43% share in retired credits over the years 2019 to 2023 — higher than any other country in the region, spurred by the country’s regulatory offset scheme.
The dataset offers insights into the strategic behaviors of businesses and industries in the region. Users of AlliedOffsets data, via the dashboard our our API can access further insights into the market.
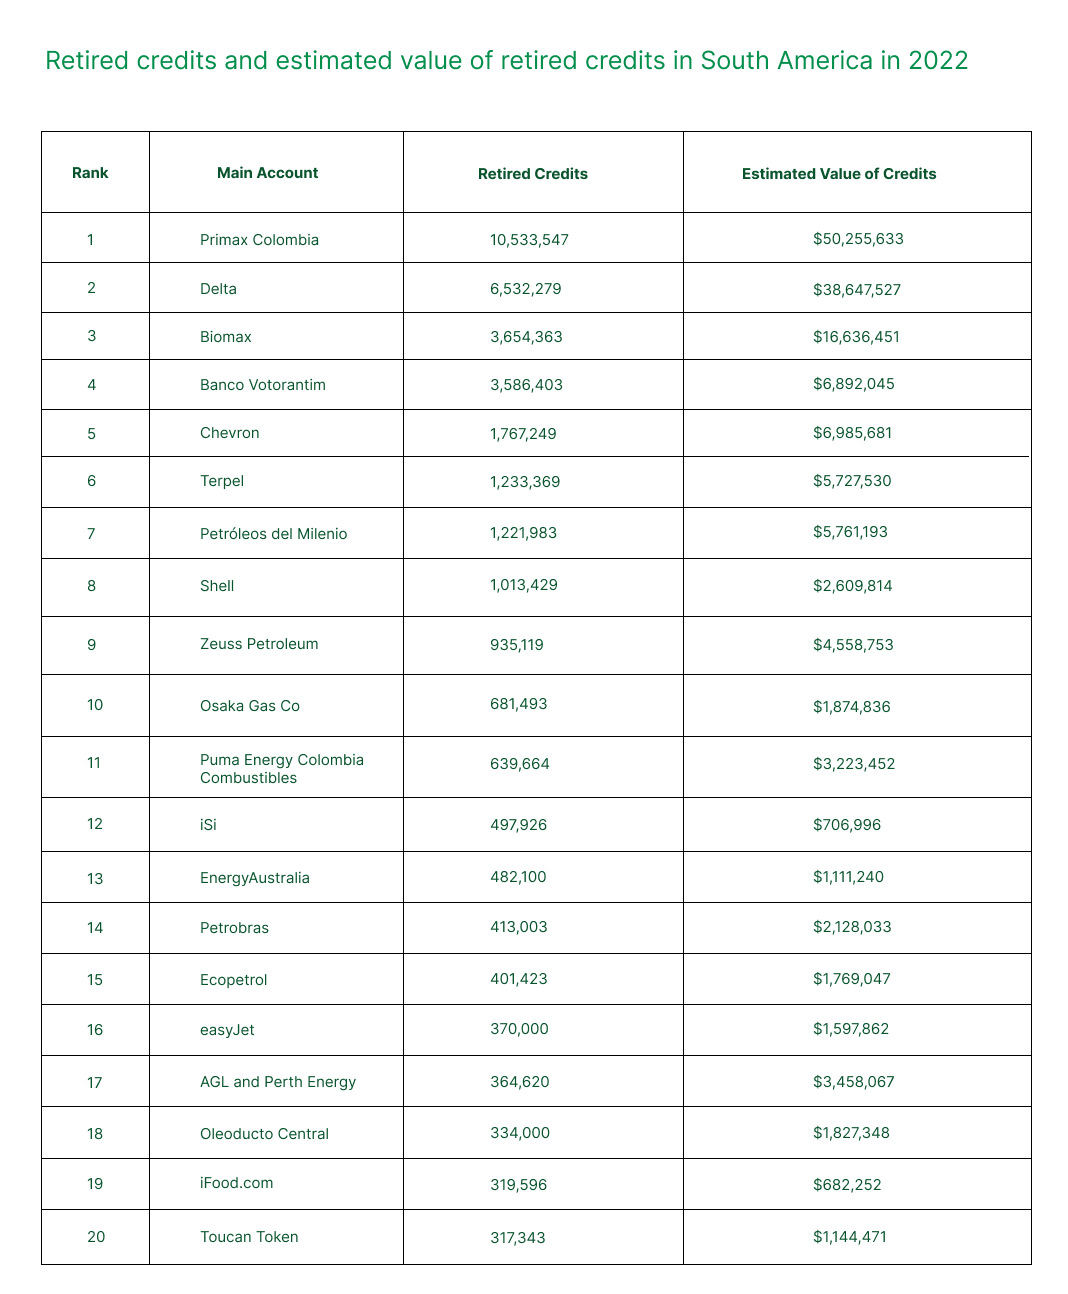
With AlliedOffsets data you can easily extract data on retired credits and estimated value of retired credits in any specified region and year.
Above is an example of retired credits and estimated value of retired credits in South America in 2022.
As shown in the table, Primax Colombia is leading the way with over 10 million retired credits and a value of over $50 million.
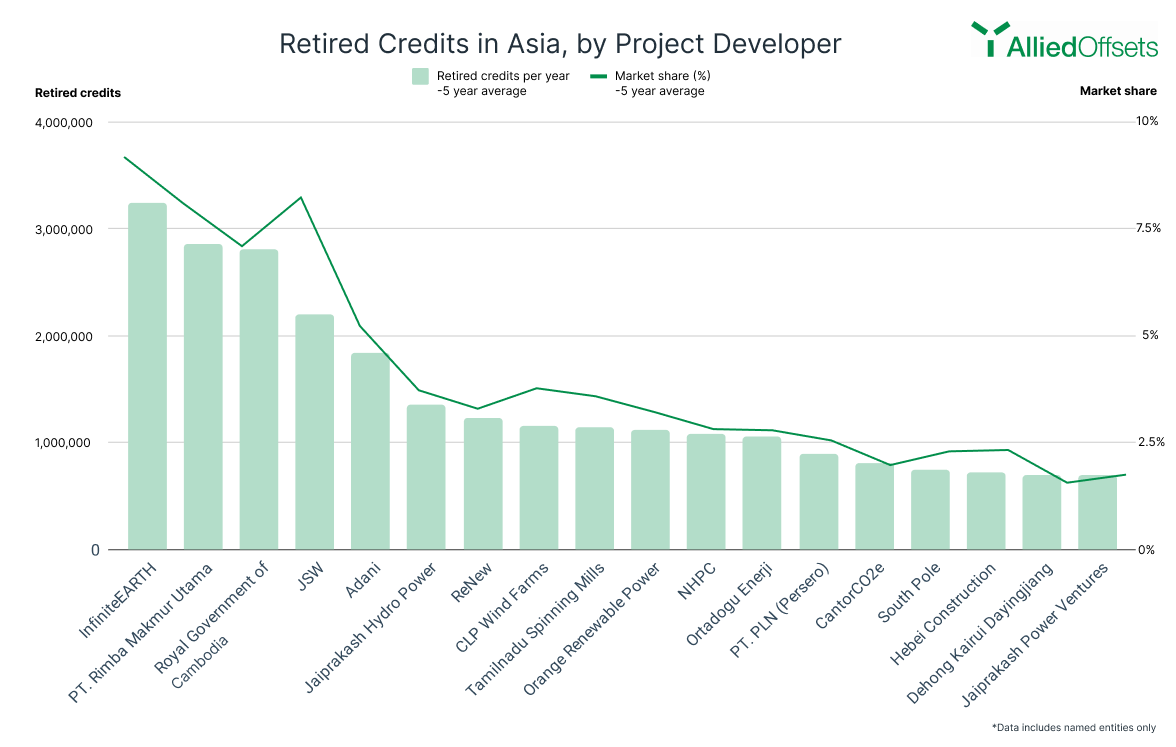
What project developers have retired the most credits in Asia? and who has had the biggest market share over the last five years?
With AlliedOffsets data you can quickly identify who has retired the most credits and what project developers have the biggest market share in any specific region and year.
For example, as shown in this graph, InfiniteEARTH (the developer for Rimba Raya, the most retired project of all time) is topping the chart with an average of 3,236,637 retired credits and a market share of 9.18% in the last five years.
AlliedOffsets data can be used and modelled in thousands of different ways to help you find exactly the data you are looking for.
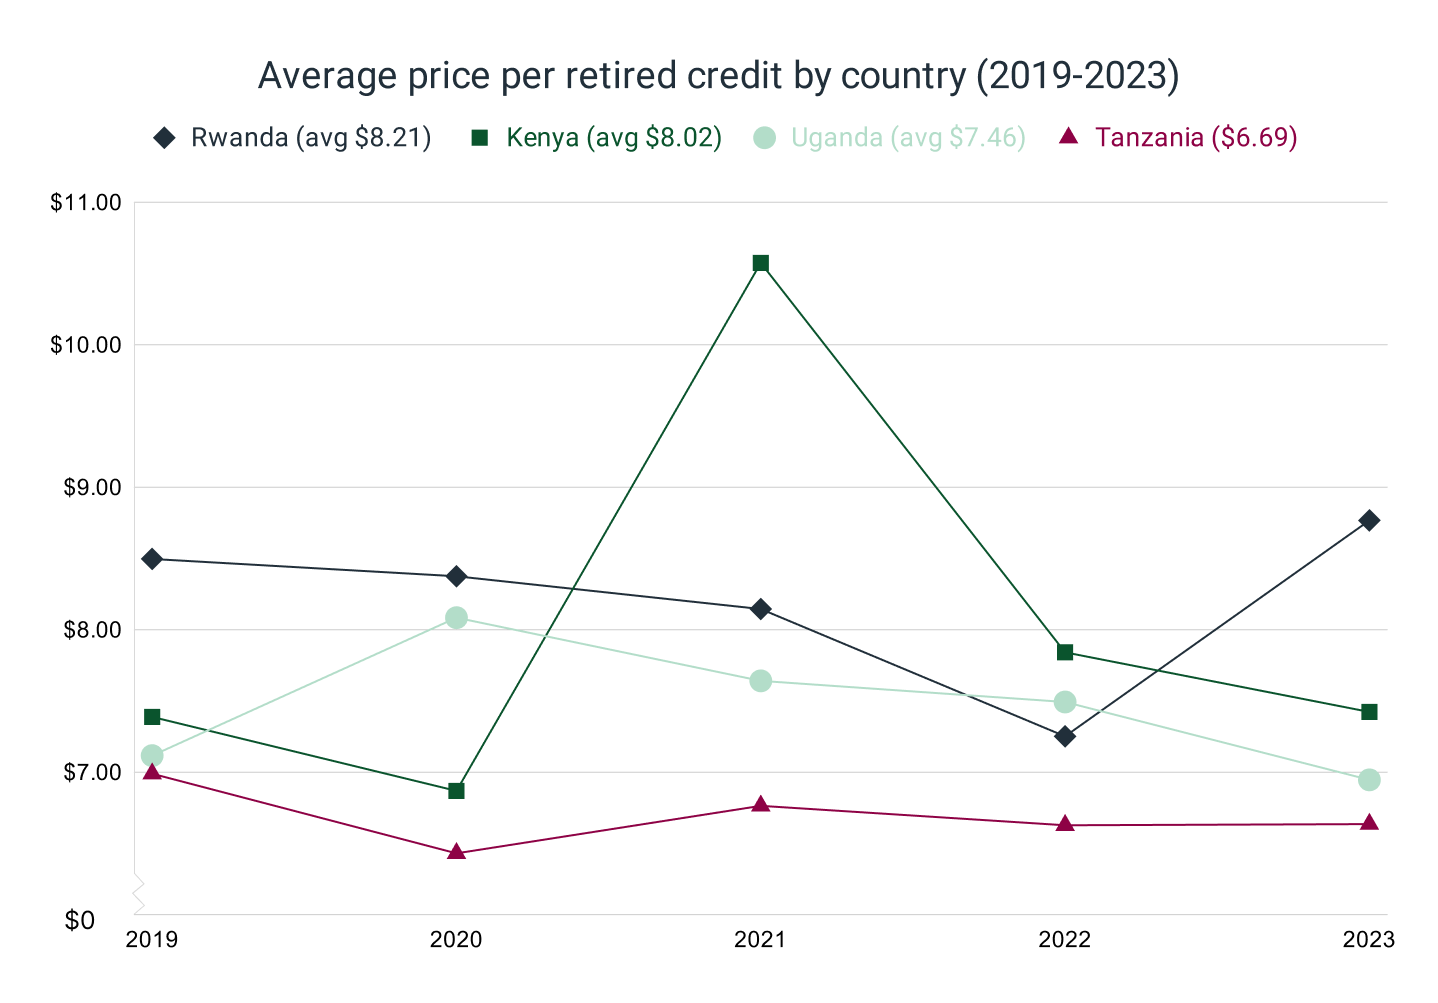
Some of our clients are using our data to compare how the average price per retired credit has changed in the last few years, and how it compares to other countries in the same region.
As an example, we’ve put together an graph of average prices per retired credit comparing Rwanda, Kenya, Uganda and Tanzania in the last five years.
As we can see in the graph, there have been big price differences over the years, and between the countries – with an average of $6.69 in Tanzania and $8.21 in Rwanda between 2019 and 2023.
Learn more about AlliedOffsets data by booking a call with our team: https://alliedoffsets.com/schedule-meeting/
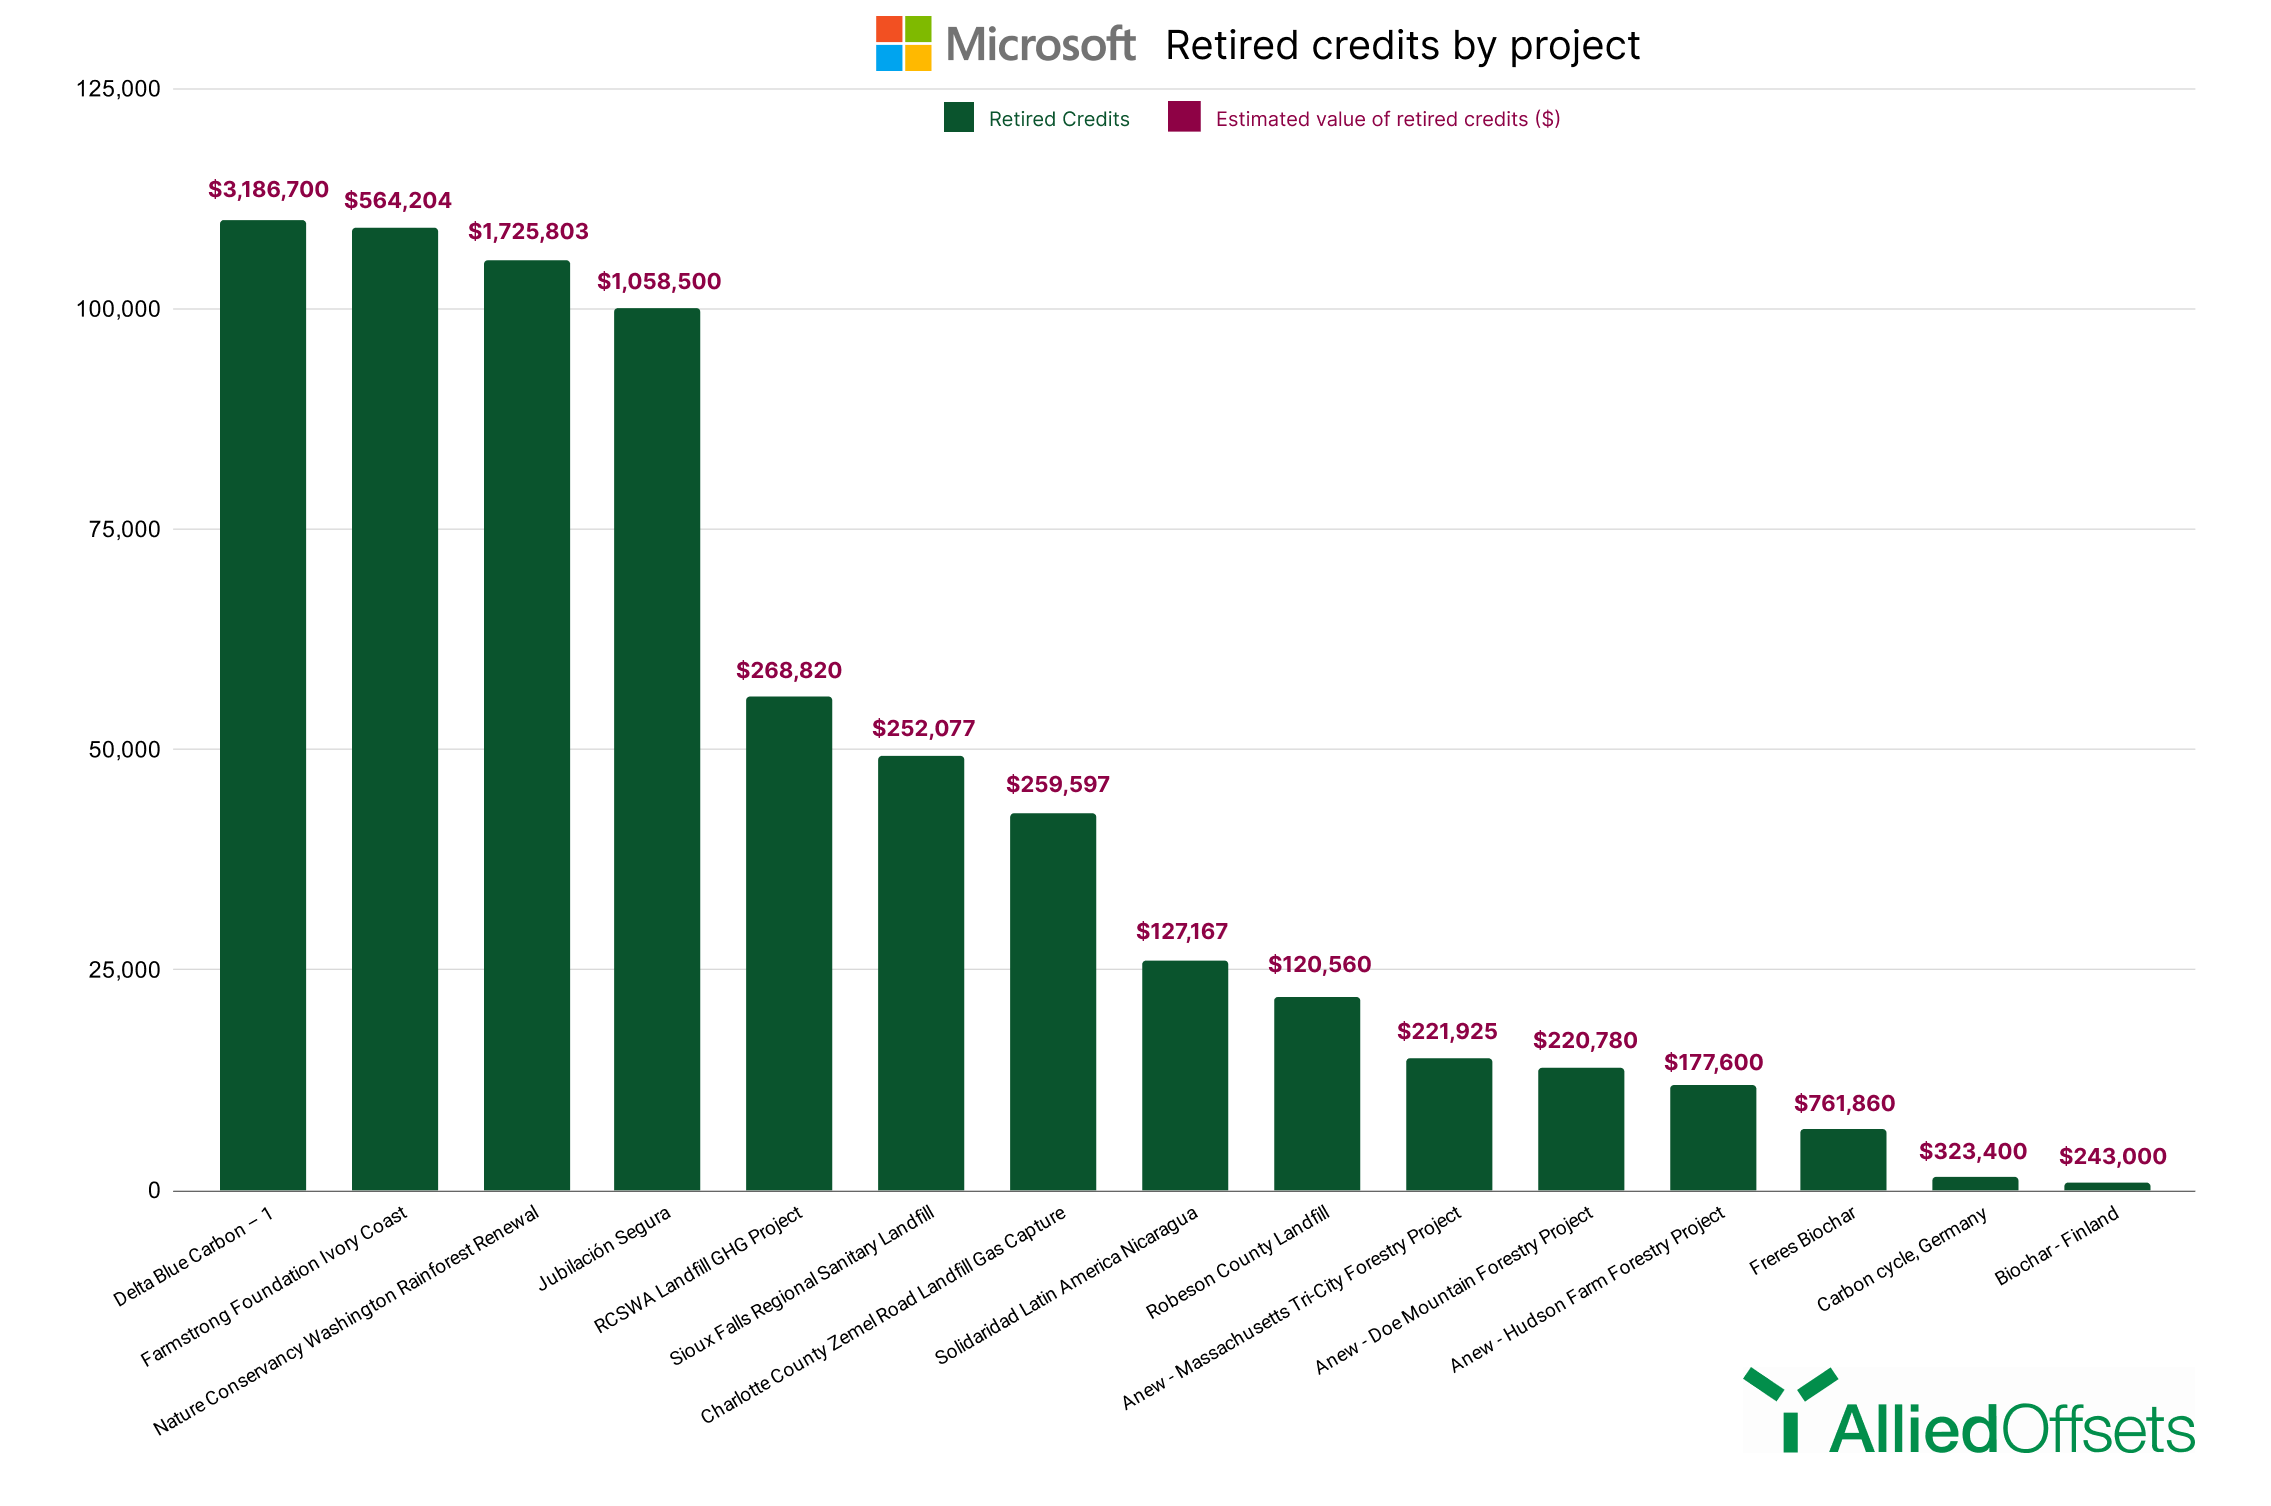
Microsoft is one of the leading buyers of carbon credits (including CDR credits) and have retired over 800,000 credits in the last two years.
Some of the most popular projects include Delta Blue Carbon – 1, Farmstrong Foundation Ivory Coast and Nature Conservancy Washington Rainforest Renewal project.
To access the full list of projects and value of retired credits made by a specific buyer, please speak to a member of our team.
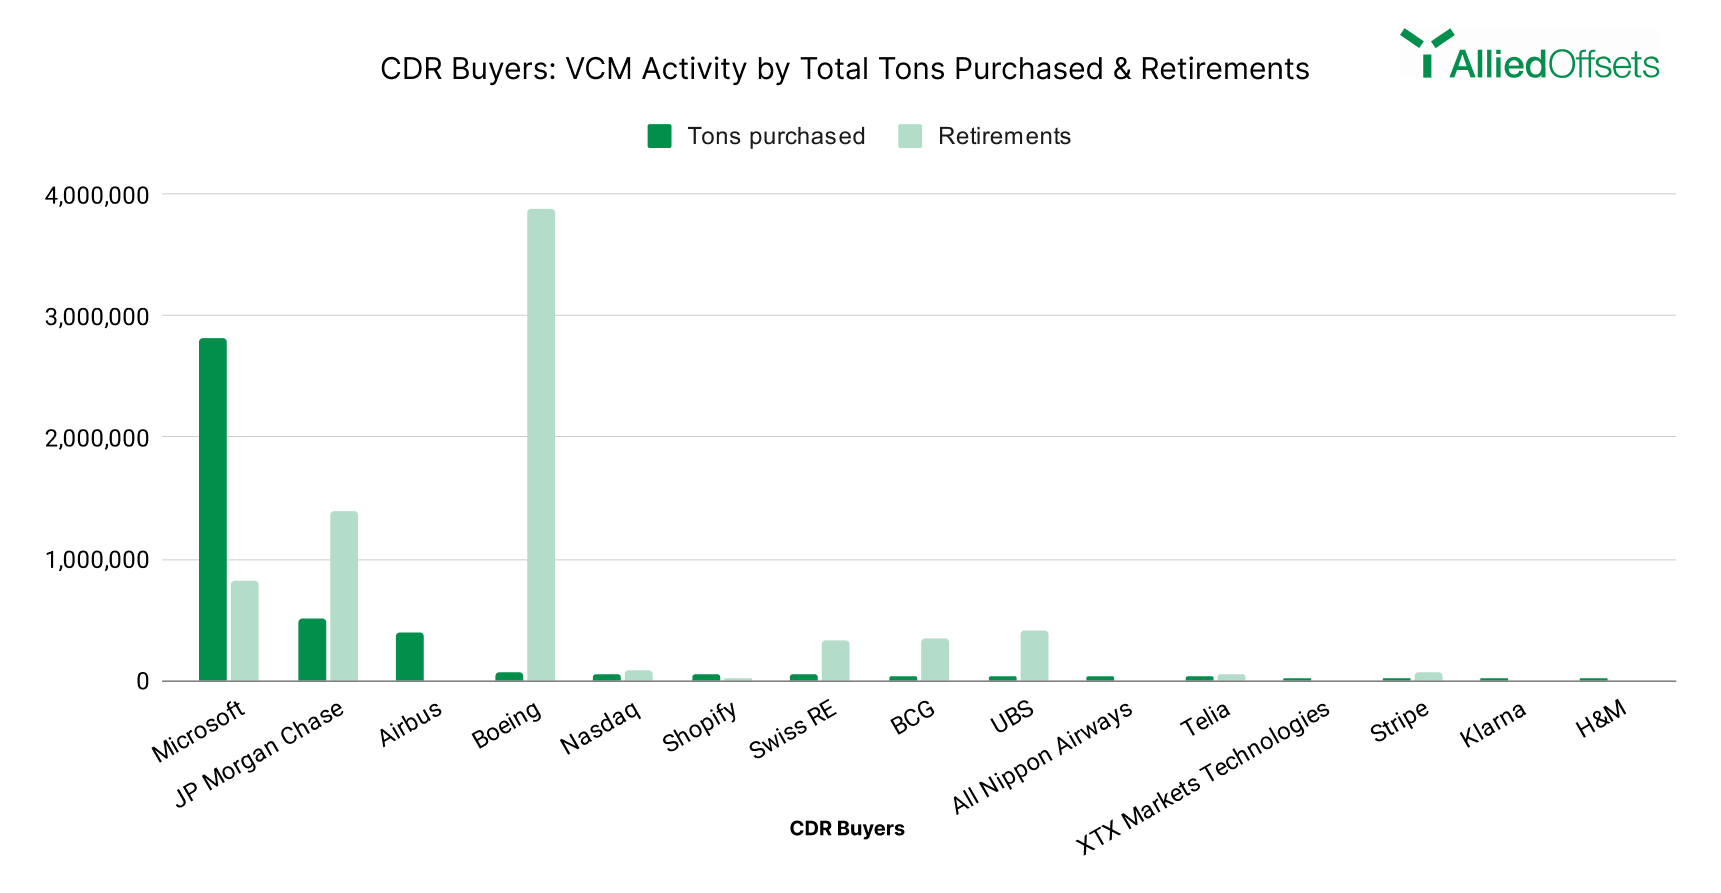
We’ve been analysing the top CDR buyers to compare to their overall activity levels in the VCM.
Here’s an overview of the top 15 CDR buyers and the total tons they purchased from CDR firms vs. their activity in the ‘traditional’ VCM.
As we can see in the graph, Microsoft remains the biggest spender in terms of credits purchased (almost 3 million) and Boeing tops the chart in terms of overall retirements with a total of almost 4 million.